
Mean Absolute Deviation Calculator– (MAD) calculator is a tool used to measure the average distance between each data point and the mean of a dataset. It helps in measuring the variability or dispersion in data. By entering a set of numbers, the calculator quickly calculates the MAD, making it useful for statistics, data analysis, and quality control. It is simple, efficient, and ideal for students, teachers, and analysts.
🎯 Why Mean Absolute Deviation Calculator (MAD) is Important for Students Learning Statistics
When you’re just starting to learn statistics, it’s easy to focus only on the average (mean) of a data set. But the average alone doesn’t tell the whole story.
That’s where Mean Absolute Deviation (MAD) comes in.
🧠 1. It Helps Students Understand Data Spread
Two data sets can have the same mean, but look completely different when it comes to how the numbers are distributed.
For example:
Set A: [5, 5, 5, 5, 5]
Set B: [1, 3, 5, 7, 9]
Both have a mean of 5, but Set B is much more spread out than Set A.
MAD helps students see and measure that spread. It gives a number that represents how much the data varies from the mean.
📊 2. It Builds a Foundation for Advanced Concepts
MAD is often the first introduction to variability in statistics for students. Once students understand MAD, it becomes easier to grasp more complex concepts later on, like:
Standard deviation
Variance
Interquartile range
Z-scores
Understanding MAD lays the groundwork for these topics by helping students recognize the importance of measuring how data varies—not just what the average is.
🧩 3. It Encourages Deeper Thinking About Data
Students learn to ask smarter questions like:
“How consistent is this data set?”
“Are the numbers tightly grouped or all over the place?”
“What does the MAD tell me about this group?”
This kind of critical thinking is a key part of data literacy, which is a valuable life skill in a world full of graphs, surveys, and stats.
🎓 4. It’s Often in the Curriculum
For many students (especially in middle school and high school), MAD is part of standardized tests and math curricula. Understanding how to calculate and interpret it is a practical skill for:
Homework assignments
Data analysis projects
Test prep (SAT, ACT, AP Stats, etc.)
🛠️ 5. It Makes Learning Stats Less Intimidating
MAD is straightforward to calculate, especially when compared to standard deviation. By learning MAD first, students gain confidence and see that they can handle statistics—it’s just about breaking things down into steps.
📌 Summary:
helps students go beyond averages and understand what data is really saying. It teaches essential skills like measuring variability, interpreting results, and thinking critically—making it a crucial stepping stone in learning statistics.
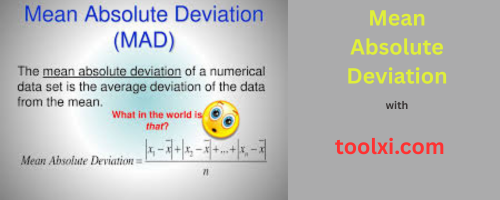
🔍 What is the mean absolute deviation Calculator (MAD)?
The mean absolute deviation (MAD) is a statistical measure used to describe how spread out or scattered the numbers in a data set are. Simply put, it tells you how far each number in a data set is, on average, from the mean (average) of that data set.
Let’s break that down:
Mean = the average of all the numbers.
Absolute deviation = how far each number is from the mean, without considering whether it’s above or below (we ignore negative signs).
MAD = the average of all those absolute deviations.
✅ Why is it called “absolute”?
Because we only care about the distance from the mean – not whether it is above or below. So we take the absolute value of each difference (i.e., turning all negative numbers into positive numbers).
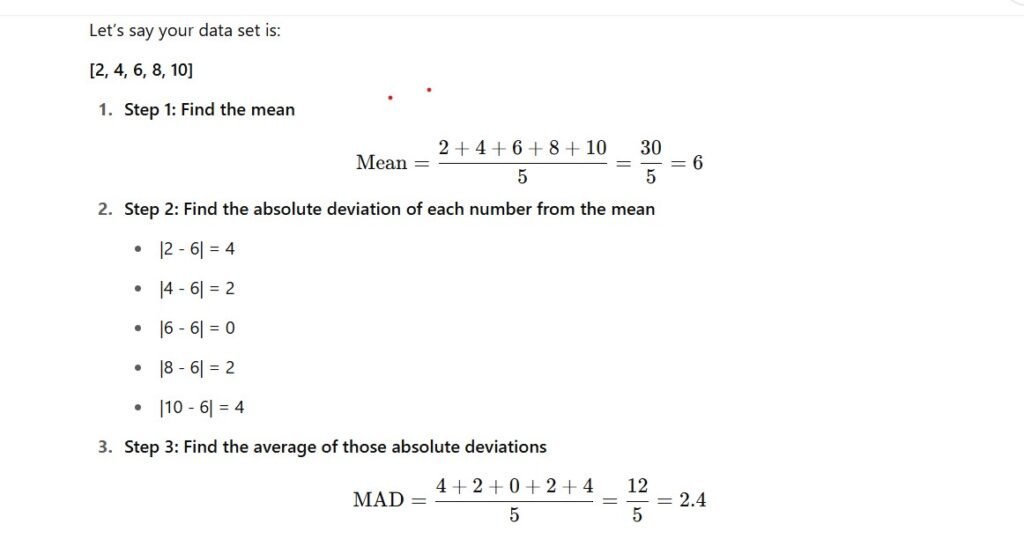
🧠 Simple Example:
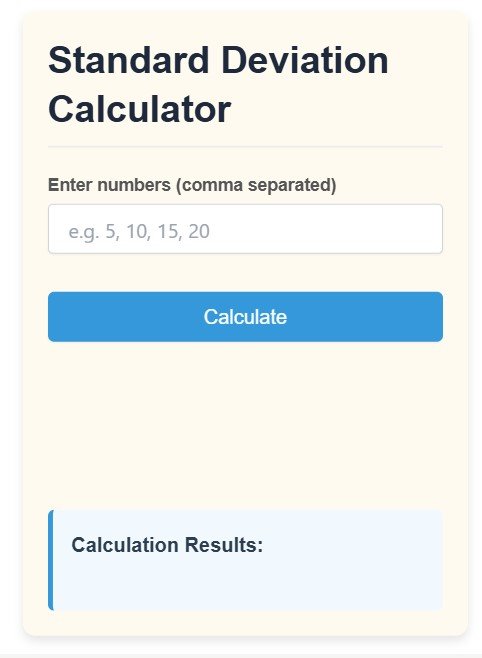
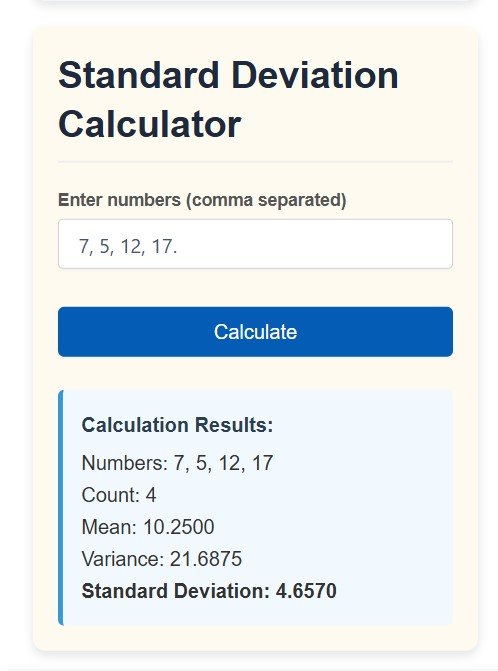
How to Use Mean Absolute Deviation Calculator
- Open TOOLXICOM
- .Go to Math Calculator
- Enter numbers in comma separated as your requirement
📌 Summary:
MAD shows how much the numbers in a data set vary from the average.
A smaller MAD means the numbers are closer together.
A larger MAD means the numbers are more spread out.
It’s a simple but powerful way for students to understand variability in a set of data.
.
🎯 Why Mean Absolute Deviation (MAD) is Important for Students Learning Statistics
When you’re just starting to learn statistics, it’s easy to focus only on the average (mean) of a data set. But the average alone doesn’t tell the whole story.
That’s where Mean Absolute Deviation (MAD) comes in.
🧠 1. It Helps Students Understand Data Spread
Two data sets can have the same mean, but look completely different when it comes to how the numbers are distributed.
For example:
Set A: [5, 5, 5, 5, 5]
Set B: [1, 3, 5, 7, 9]
Both have a mean of 5, but Set B is much more spread out than Set A.
MADhelps students see and measure that spread. It gives a number that represents how much the data varies from the mean.
📊 2. It Builds a Foundation for Advanced Concepts
MAD is often the first introduction to variability in statistics for students. Once students understand MAD, it becomes easier to grasp more complex concepts later on, like:
Standard deviation
Variance
Interquartile range
Z-scores
Understanding MAD lays the groundwork for these topics by helping students recognize the importance of measuring how data varies—not just what the average is.
🧩 3. It Encourages Deeper Thinking About Data
Students learn to ask smarter questions like:
“How consistent is this data set?”
“Are the numbers tightly grouped or all over the place?”
“What does the MAD tell me about this group?”
This kind of critical thinking is a key part of data literacy, which is a valuable life skill in a world full of graphs, surveys, and stats.
🎓 4. It’s Often in the Curriculum
For many students (especially in middle school and high school), MAD is part of standardized tests and math curricula. Understanding how to calculate and interpret it is a practical skill for:
Homework assignments
Data analysis projects
Test prep (SAT, ACT, AP Stats, etc.)
🛠️ 5. It Makes Learning Stats Less Intimidating
MAD is straightforward to calculate, especially when compared to standard deviation. By learning MAD first, students gain confidence and see that they can handle statistics—it’s just about breaking things down into steps.
📌 Summary:
MAD helps students go beyond averages and understand what the data is really saying. It teaches essential skills like measuring variability, interpreting results, and thinking critically – making it an important stepping stone in learning statistics.
⚙️ The benefits of using a calculator to simplify the process
While it’s important to learn how to calculate the Mean Absolute Deviation (MAD) by hand, doing it manually every time – especially with large data sets – can be tedious, time-consuming, and error-prone. Here’s why:
⏱️ 1. Saves time
Calculating MAD manually involves multiple steps:
- Finding the mean
- Subtracting each value from the mean
- Taking the absolute values
- Calculating the mean of those values
If you’re working with 10, 20, or more numbers, that’s a lot of work. A calculator can do all of this instantly – just plug in your numbers, and you’re done. This means more time to study, review, or complete your homework quickly.
🎯 2. Reduces errors
Let’s be real – when you’re doing a lot of steps by hand, it’s easy to:
- Make a decimal mistake
- Forget to use an absolute value
- Add something incorrectly
A good MAD calculator does the math for you, reducing the risk of simple errors that can lead to incorrect answers – especially on assignments, tests, or projects.
📚 3. Helps you focus on understanding, not just calculating
The real goal in statistics isn’t just crunching numbers – it’s understanding what those numbers mean. When a calculator handles the repetitive math, you can focus more on:
- Interpreting the result (e.g. (e.g., What does a MAD of 4.5 mean?)
- Comparing different data sets
- Learning how MAD relates to other concepts like range or standard deviation.
So instead of getting bogged down in steps, you can spend time learning what really matters.
💡 4. Great for practice and self-checking
Even if you’re studying the manual method (which you should!), a calculator is a great way to check your work.
You can:
- Solve the problem first hand
- then use a calculator to check your answer.
This is a great way to catch mistakes and build confidence in your understanding.
🧠 5. Promotes smart learning habits.
Using a calculator doesn’t mean you’re cutting corners – it means you’re learning how to work smarter, not harder. In the real world, professionals use tools to save time and reduce errors. So by using a calculator properly, you’re already thinking like a data scientist or analyst.
📌 summary:
The mean absolute deviation calculator is a powerful tool for students. It saves time, prevents errors, and helps you focus on real learning from number-crunching. Whether you’re double-checking homework or analyzing large data sets, it makes the process faster, easier, and more efficient.

About toolxi.com
Your all-in-one digital toolkit
“Hi, I’m Prachi , creator of toolxi.com…” your free, no-nonsense solution for everyday digital tasks. I’m designed to simplify your workflow with intuitive tools for calculations, PDF manipulation, image editing, text processing, and more. Whether you’re a student, professional, or creator, my goal is to save you time and effort with reliable, browser-based utilities that require zero installation or signup. I’m constantly evolving based on your needs, so feel free to explore and transform how you work online! Try our top tool → Toolxi.com